This post is to investigate:
- What does the PC1 imply?
- Why and how to remove the effect of cell-size?
suppressPackageStartupMessages(library(Seurat))
suppressPackageStartupMessages(library(autosc))
suppressPackageStartupMessages(library(dplyr))
suppressPackageStartupMessages(library(Matrix))
# ggplot2::theme_set(ggpubr::theme_classic2(base_size = 12))
# umi <- Read10X(data.dir = "~/Downloads/filtered_gene_bc_matrices/hg19/")
# umi <- as.matrix(umi)Process using autosc
I developed some extension functions on top of Seurat package, and wrapped them to a R package autosc. autosc has more options in terms of normalization, transformation, selecting HVG, and visualization.
The processing of pbmc3k is similar to Seurat’s tutorial, and it contains following steps: 1) Remove genes not detected by any cell and remove cells without any signals. 2) Normalize to median cell size. 3) Log transform. 4) Select HVG (highly variable gene) based on user-defined strategy. Nothing fancy.
The only thing deserves attention: it does not explicitely remove cell-size information. By contrast, Seurat would regress out the effect by its function ScaleData.
# autosc_obj <- run_seurat(
#   umi,
#   hvg_method = 'bo',
#   normalize_method = 'median',
#   transform_method = 'log',
#   min_cells_per_gene = 1,
#   min_genes_per_cell = 1)
# saveRDS(autosc_obj, '~/Downloads/autosc.rds')
autosc_obj <- readRDS('~/Downloads/autosc.rds')
Visualize marker genes expression on tSNE space
mg <- c("MS4A1", "GNLY", "CD3E", "CD14",
        "FCER1A", "FCGR3A", "LYZ", "PPBP", "CD8A")
Autosc (left) works similar to the result of Seurat (right), and nothing surprising happens so far.

Visualize marker genes expression on PCA space
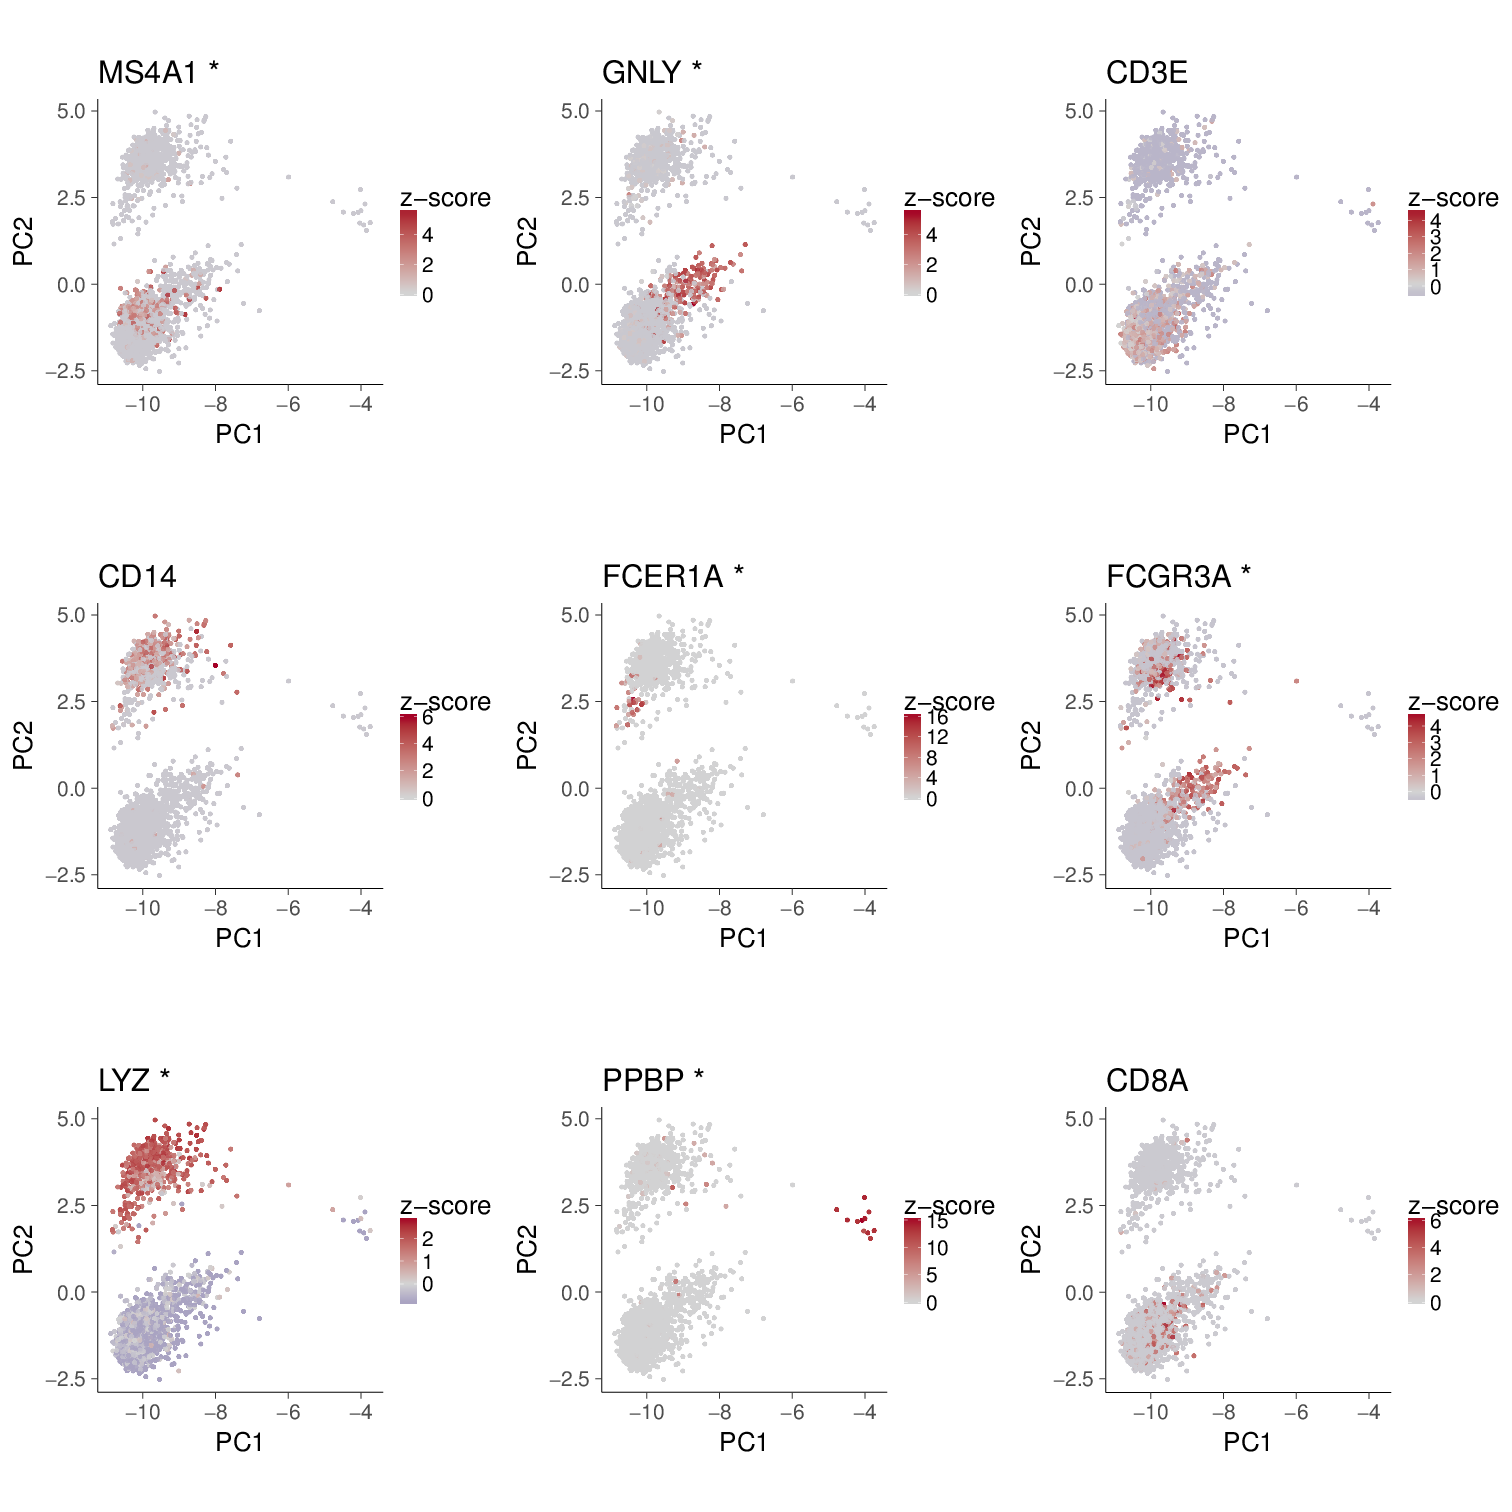
PC1 v.s. PC2 could not properly separate cell types
Something is not feeling good, in particular after examining the explained %variance. PC1 carries >90% variance.

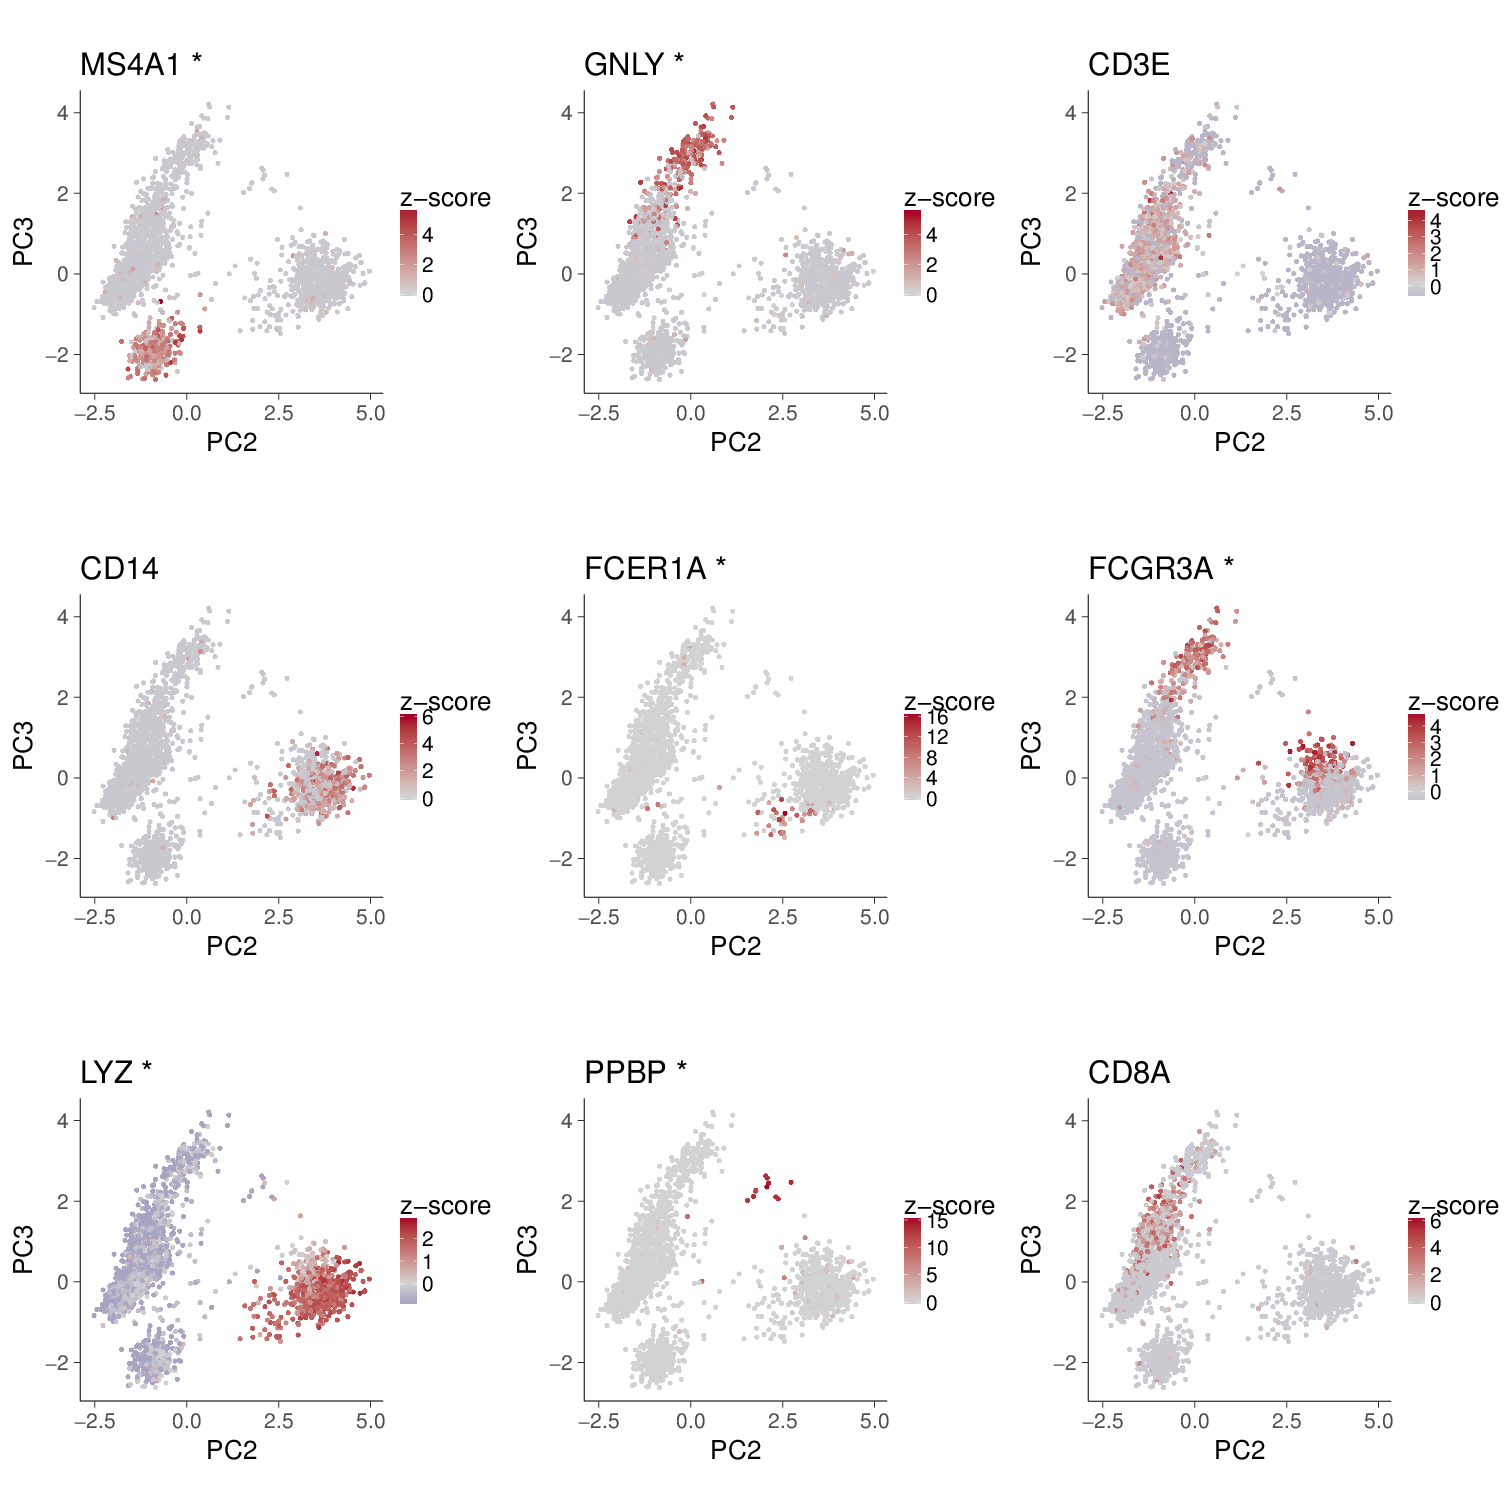
On the contrary, the PC2-3 space seems good at classifying cell types.
PC1 is dominated by cell size
To further investigate what is PC1, here I mask the PC1-2 space by cell size information (used_cell_size) rather than marker gene expression level.
For each cell, I calculated its used_cell_size by summing up the values of HVGs in the scaled matrix (i.e., after normalization and log transformation). Actually, the scaled matrix is exactly the input for running PCA and then tSNE.
Other three types of information about cell are:
- nUMI: the number of total UMIs of each cell
- nGene: the number of detected genes per cell
- percent.mito: the percentage of mitochondrial genes in all genes per cell, which is a signal to tell if cell is in unhealthy status.
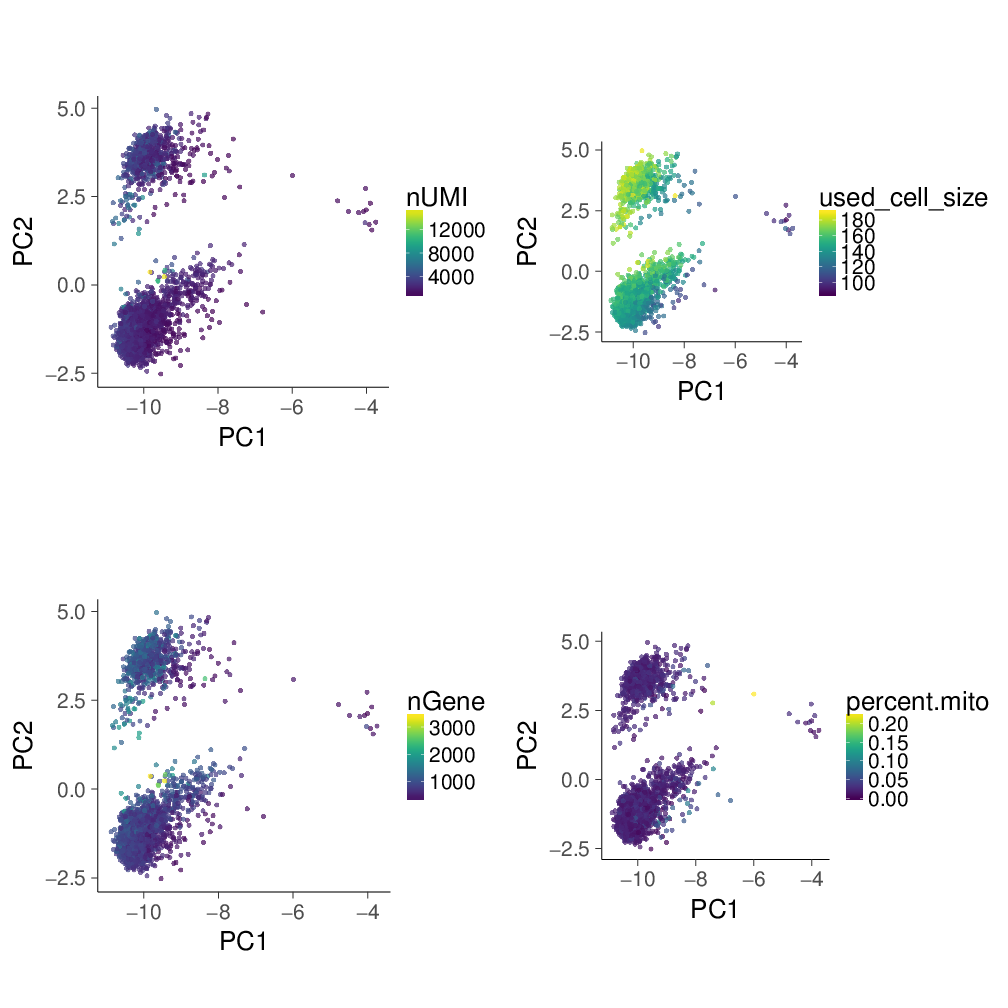
PC1 seems be dominated by used_cell_size.
On the contrary, PC2-3 and tSNE look similar, especially in terms of the equally distributed used_cell_size.

Summary
PC1 is dominated by cell size, and here the cell size is the sum of HVGs values in the scaled matrix. This is because the log transformation greatly distorts the normalized cell size, and PCA is to capture global detonating difference.
Does it mean log transformation should be abandoned, despite its good effect on stabilizing variance of highly expressed genes? Not necessary. As PC1 can be considered by the cell size information, just check PC2-PC3.